Mersey Gateway Bridge and Silver Jubilee Bridge Statistics
Merseyflow on behalf of the Mersey Gateway Crossings Board, have put together the below infographics containing quarterly statistics for the Mersey Gateway Bridge and Silver Jubilee Bridge.
The dashboards provide a range of in-depth statistics and graphs that show detailed information on the number of Penalty Charge Notices (PCNs) issued, payments made on time, payment methods, average daily traffic, total revenue received from tolls/charges, and what percentage of this comes from PCNs. It provides a quick and easy way to view key statistics about the bridges and tolls/charges.

Issue 33 January 2026 - March 2026
Click the image to see it in full size

Issue 32 October 2025 - December 2025
Click the image to see it in full size
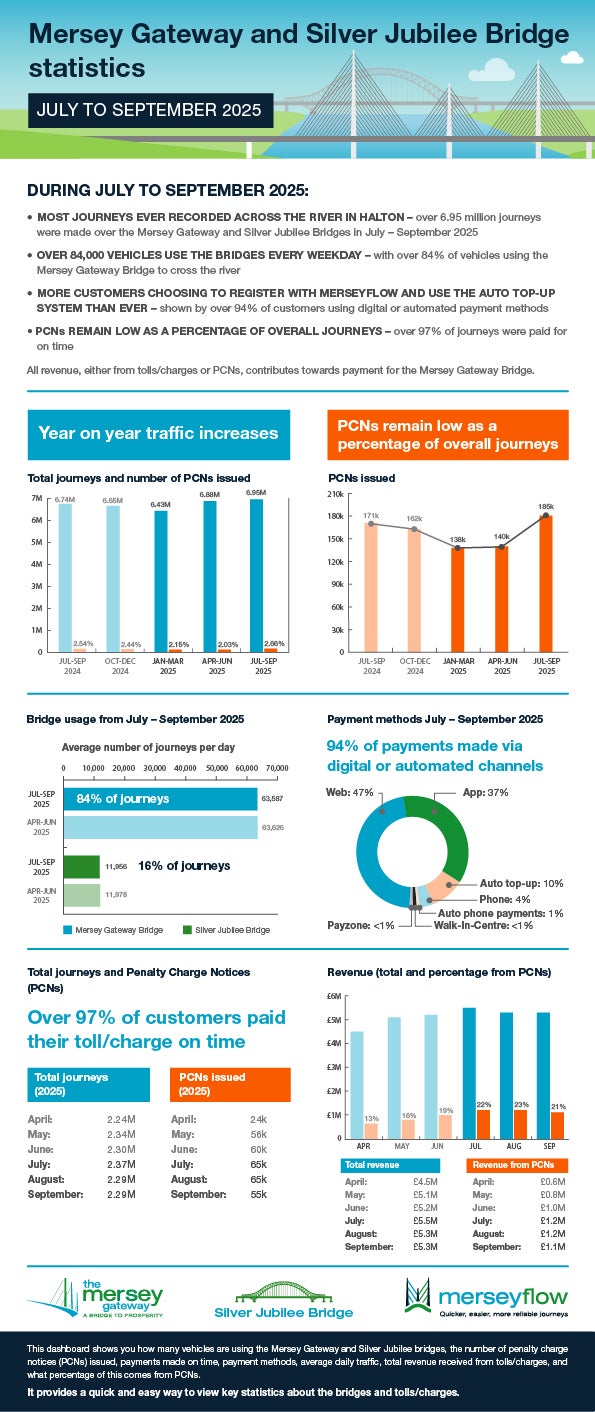
Issue 31 July 2025 - September 2025
Click the image to see it in full size
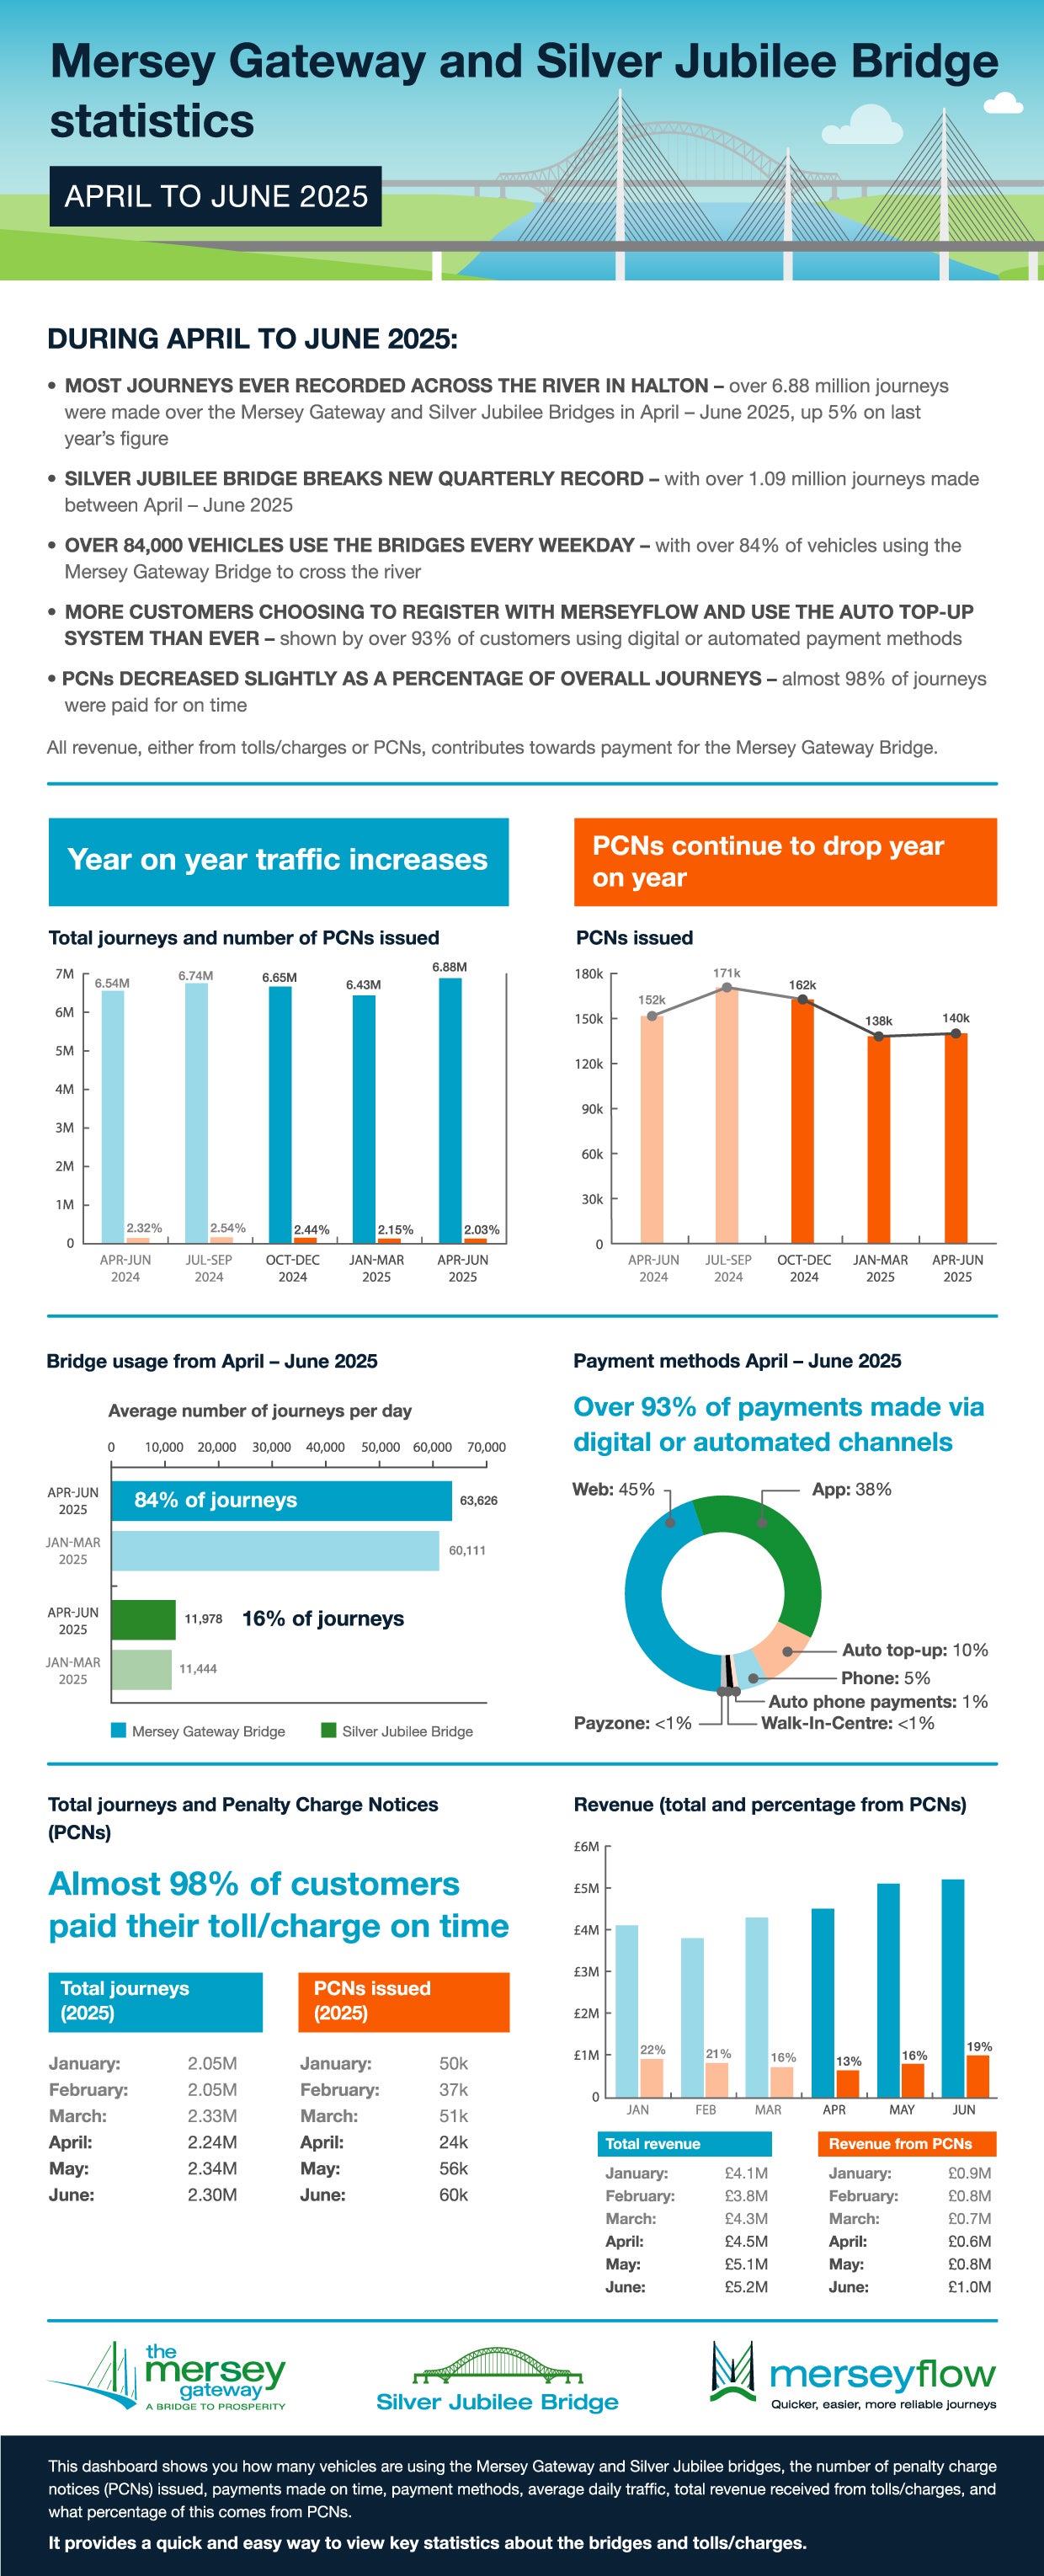
Issue 30 April 2025 - June 2025
Click the image to see it in full size
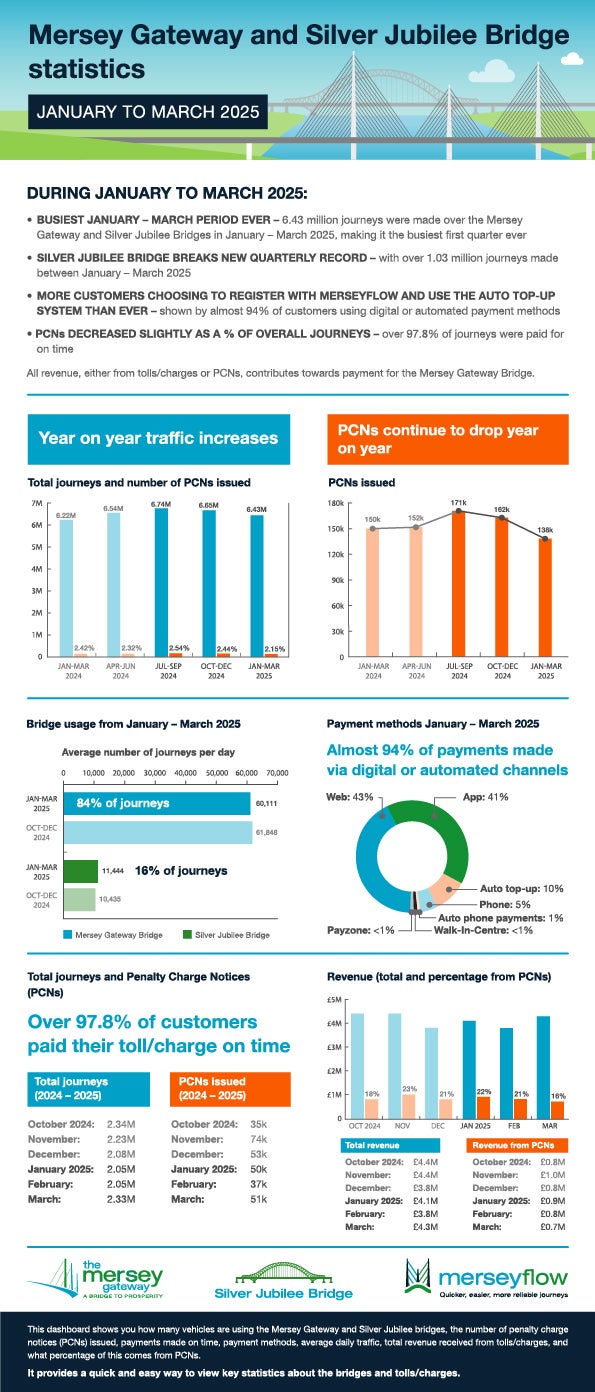
Issue 29 Jan 2025 – March 2025
Click the image to see it in full size
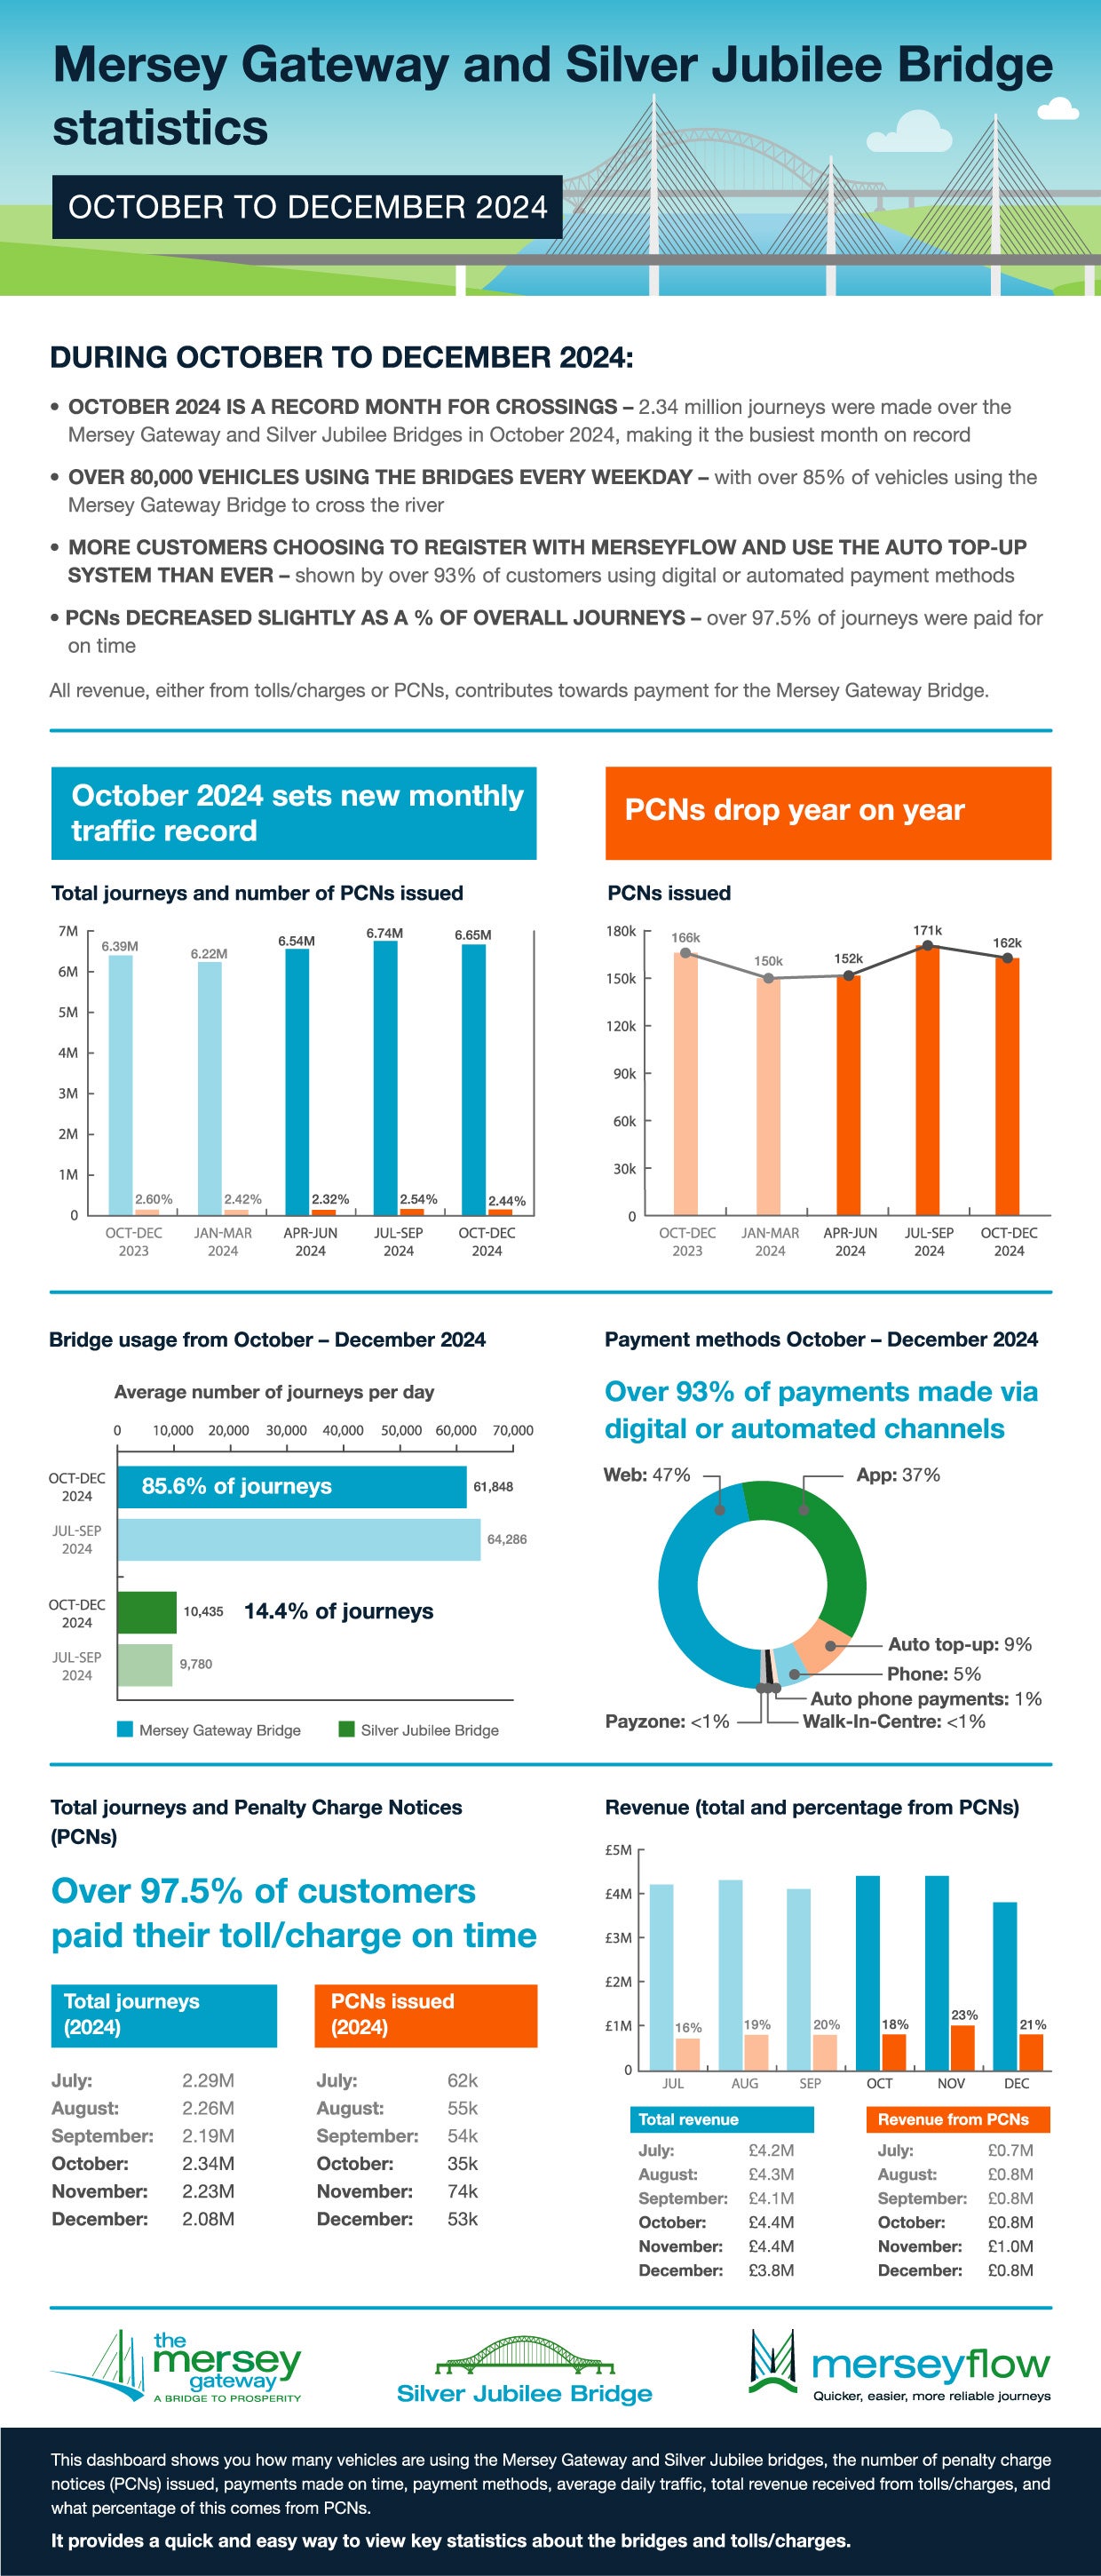
Issue 28 Oct 2024 – Dec 2024
Click the image to see it in full size
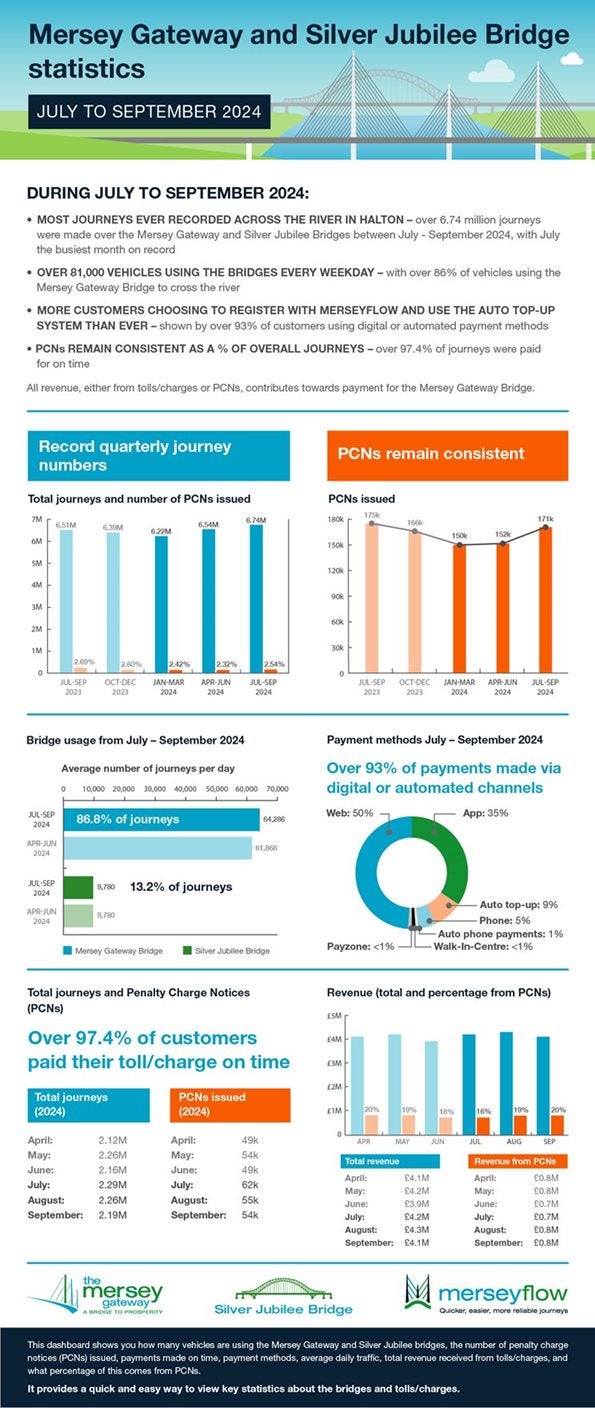
Issue 27: July 2024 – Sept 2024
Click the image to see it in full size
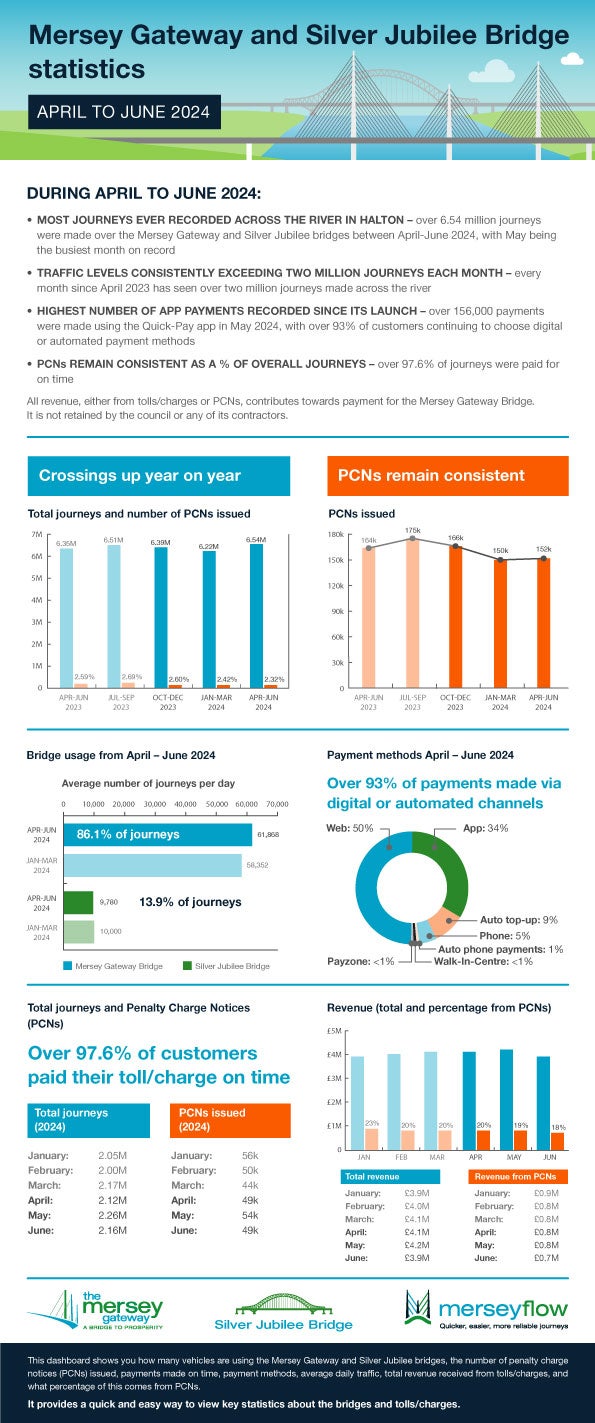
Issue 26: April 2024 – June 2024
Click the image to see it in full size
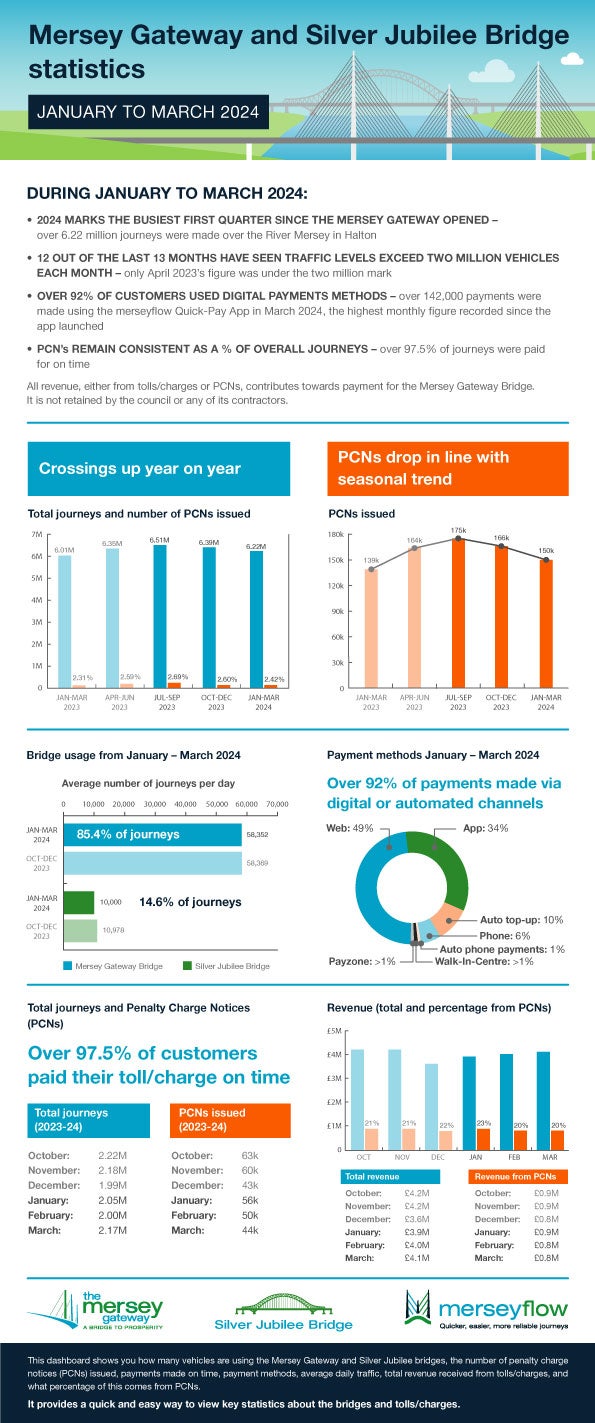
Issue 25: Jan 2024 – March 2024
Click the image to see it in full size
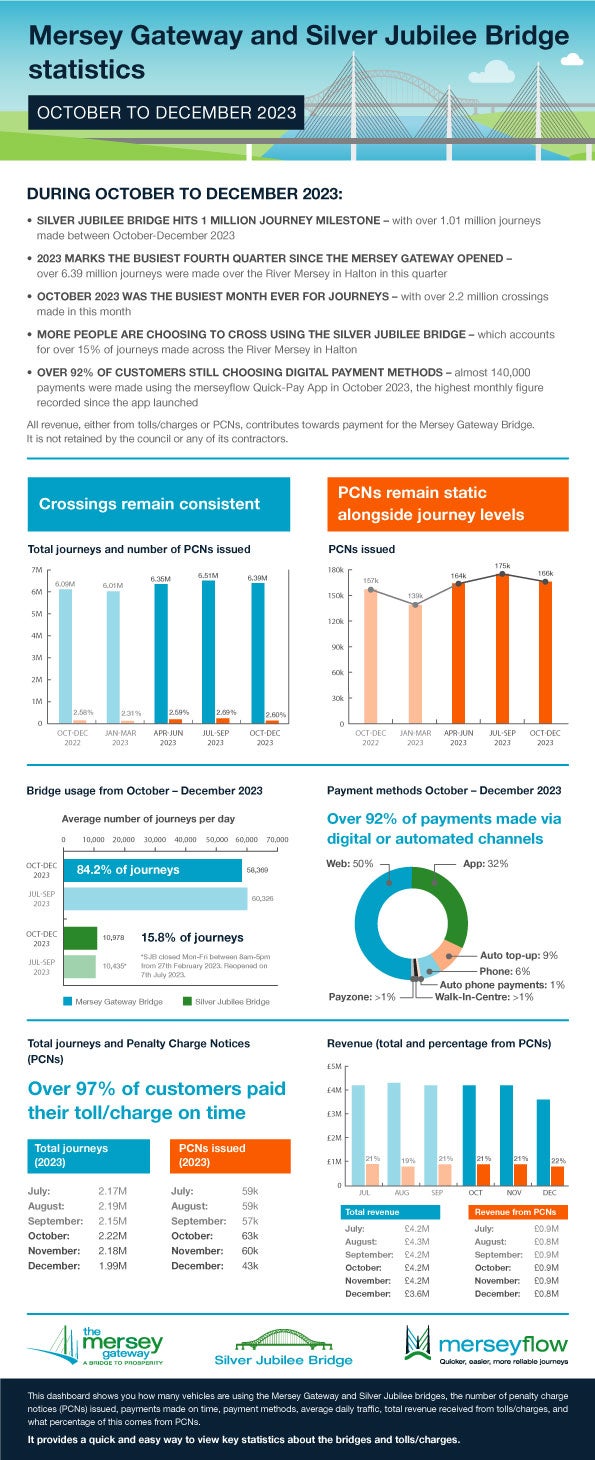
Issue 24: Oct 2023 – Dec 2023
Click the image to see it in full size
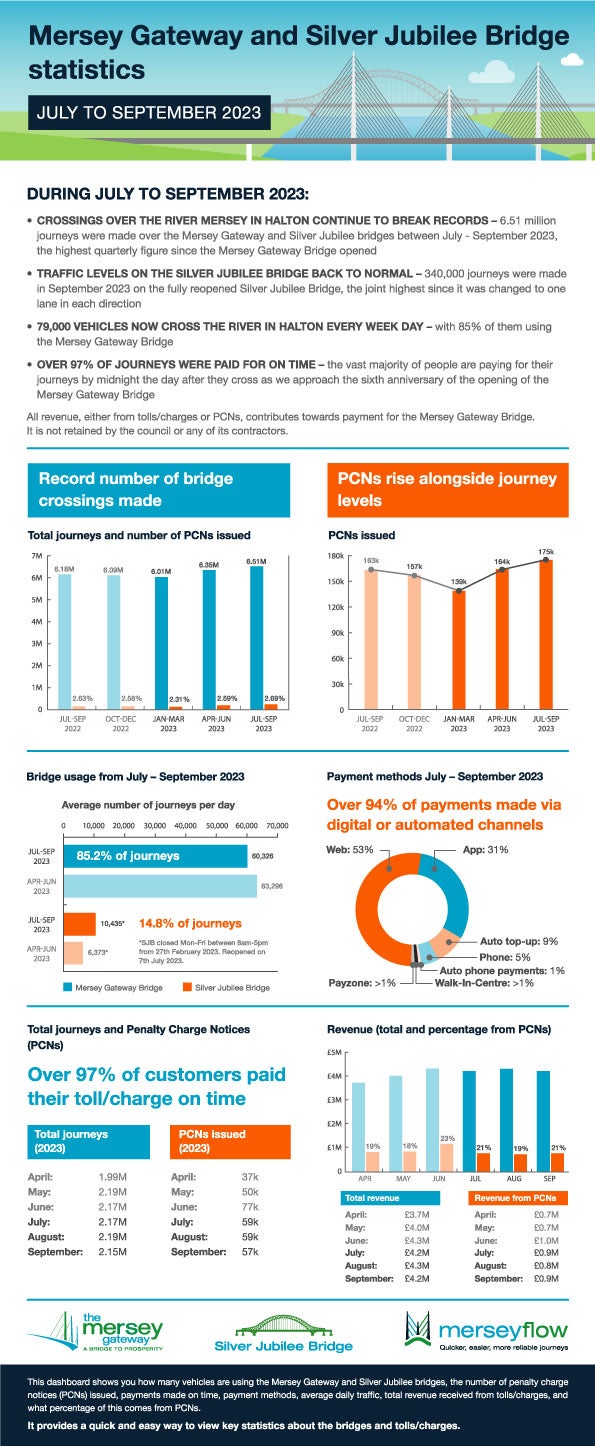
Issue 23: July 2023 – Sept 2023
Click the image to see it in full size
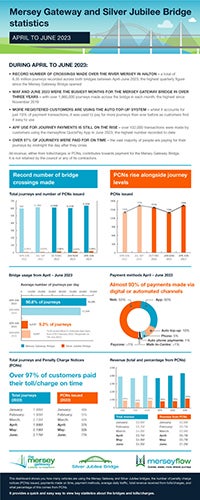
Issue 22: April 2023 – June 2023
Click the image to see it in full size